Neural oscillatory activity has long been a cornerstone of neuroscience, offering critical insights into the fundamental mechanisms of neural communication, sensory perception, and higher-order cognition. Among the diverse phenomena characterized in electrophysiology, the Berger effect remains one of the most foundational yet frequently overlooked paradigms. First documented by Hans Berger, this effect describes the prominent desynchronization—or reduction—of alpha oscillatory power (8–13 Hz) in the electroencephalogram (EEG) as an individual transitions from a relaxed, eyes-closed state to an eyes-open state. This phenomenon is now widely recognized as a functional hallmark closely linked to attentional engagement and the brain's information-processing dynamics.
On January 21, 2026, a research team led by Assistant Professor Chuanliang Han—a member of the Hundred Talents Program at the School of Psychology, Shenzhen University—published a study in the prestigious journal NeuroImage. The article, titled "Localization of the Berger Effect in Human Posterior Brain Regions with Simultaneous Electroencephalogram (EEG) and Stereo-EEG (SEEG) Recordings," was completed in collaboration with Dr. Chao Zhang and Dr. Kai Zhang from Beijing Tiantan Hospital, and Dr. Chen Yao from Shenzhen Second People’s Hospital. In this study, researchers simultaneously recorded stereo-electroencephalography (SEEG) and scalp EEG signals across 36 brain regions. Spectral analyses revealed that nine specific brain regions exhibited significant state-dependent differences in alpha power. Importantly, at the group level, five posterior cortical regions demonstrating robust Berger effects were identified: the calcarine cortex, cuneus, lingual gyrus, precuneus, and supramarginal gyrus.
Site-level analyses further showed that certain subcortical structures, including the pulvinar of the thalamus, also contributed partially to this effect. In addition, component decomposition analyses indicated that the Berger effect is primarily driven by periodic alpha activity. By comparing the spectral characteristics and alpha peak frequency (APF) between SEEG and scalp EEG in the alpha band, the study confirmed that the classical scalp-level Berger effect mainly originates from posterior cortical regions, particularly the calcarine cortex (Brodmann area 17).
Overall, the findings suggest that although the Berger effect arises from a distributed cortico–subcortical network, its physical core is strongly localized within the visual cortex. This study provides precise anatomical constraints for understanding the neural dynamics underlying the posterior dominant rhythm (PDR) and offers new insights into the clinical applications of resting-state scalp EEG.
Strong Berger Effects Observed in Multiple Occipital Brain Regions
The researchers first extracted the relative power in the alpha band (8–13 Hz) and calculated the closed–open ratio (CO ratio; alpha power during eyes-closed divided by alpha power during eyes-open). A higher ratio indicates a stronger Berger effect.
The bar chart in Figure 1A presents the results across 36 brain regions, while Figure 1B details the data from individual recording sites. Statistical analyses revealed significant differences in relative alpha power between the eyes-closed and eyes-open states in nine regions: the calcarine cortex, cuneus, lingual gyrus, precuneus, supramarginal gyrus, middle frontal gyrus, as well as the superior, middle, and inferior temporal gyri (ps < 0.01).
However, further examination of the CO ratio showed that only five posterior cortical regions—the calcarine cortex, cuneus, lingual gyrus, precuneus, and supramarginal gyrus—exhibited robust Berger effects (these regions are highlighted in orange in Figures 1A and 1B). The effects observed in the remaining four regions were substantially weaker: the three temporal gyri displayed only mild effects, whereas the middle frontal gyrus showed a weak negative effect (i.e., slightly higher alpha power during eyes-open).
To illustrate these differences more clearly, Figure 1C presents the average power spectra for the nine regions. Consistent with their high CO ratios, the calcarine cortex, cuneus, lingual gyrus, and precuneus showed pronounced alpha peaks during the eyes-closed state, which disappeared when the eyes were open. Crucially, such clear oscillatory peaks were not observed in the other statistically significant regions.
Finally, the site-level analysis in Figure 1D plots the relative alpha power differences across all recording sites. The results confirm that the vast majority of sites within the posterior regions highlighted in orange exhibited strong Berger effects. This finding further explains why alpha oscillations are often referred to as the Posterior Dominant Rhythm (PDR).
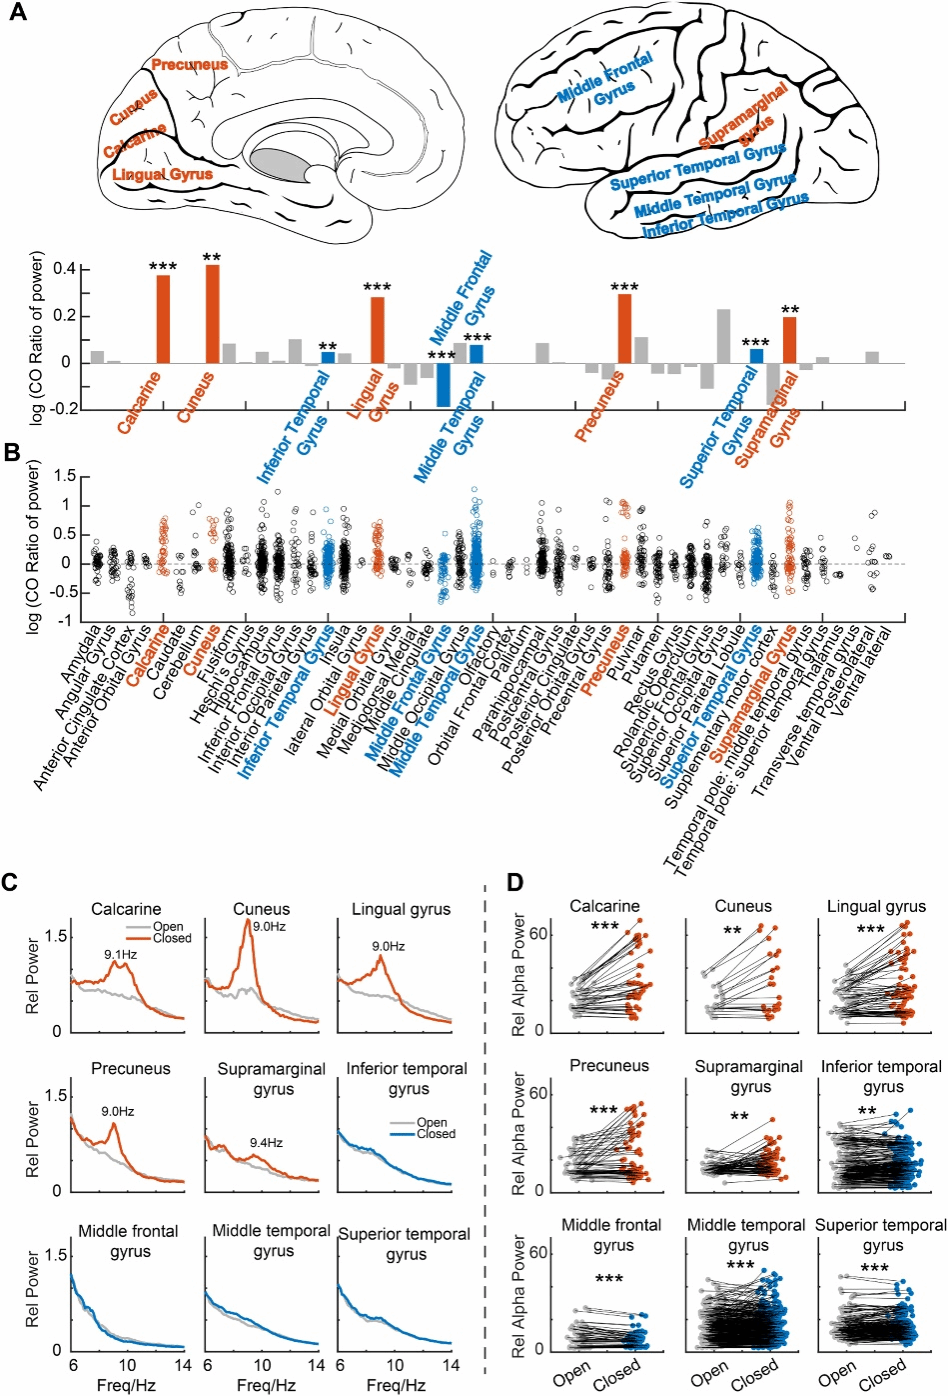
Figure 1. Berger effect at the group level.
Both Cortical and Subcortical Regions Contribute to the Berger Effect
Although the group-level analyses described above identified five posterior regions exhibiting robust Berger effects (Figures 1A–C), the site-level variability observed within these regions (Figure 1D) suggests that group averages may obscure important local neural dynamics. Therefore, electrode-level analyses are essential for revealing the spatial heterogeneity of the Berger effect within specific anatomical structures. For instance, a discrete subregion may exhibit a strong Berger effect, while adjacent areas may show little or no response. Such fine-grained effects are often attenuated during spatial averaging but can be accurately captured through site-specific analyses.
To address this heterogeneity, individual recording sites were categorized based on their CO ratio: an increase group (CO ratio > 0.15; Figure 2A), a decrease group (CO ratio < −0.15; Figure 2B), and a no-change group (Figure 2B). The proportion of recording sites belonging to each category was then calculated for each brain region, and the regions were ranked according to the percentage of sites in the increase group (Figure 2C).
This site-level analysis yielded two important findings. First, most brain regions contained at least some recording sites exhibiting a Berger effect, suggesting that the underlying neural mechanism is not strictly confined to posterior cortex but may extend across a broader spatial network. Second, the brain regions showing strong Berger effects at the group level (highlighted in orange in Figure 1) indeed contained higher proportions of increase-group sites, further confirming the initial findings. In contrast, regions marked in blue in Figure 1, although statistically significant, showed weaker group-level effects and correspondingly lower proportions of increase-group sites.
Further insights were obtained by examining the average power spectra of the top seven regions ranked by the proportion of increase-group sites. The highest-ranked regions included the calcarine cortex, lingual gyrus, cuneus, and supramarginal gyrus—the four posterior regions showing the strongest effects—as well as the superior occipital gyrus and inferior occipital gyrus, both located in posterior cortex. Notably, the pulvinar nucleus, a subcortical thalamic structure, ranked seventh. Given that previous studies have suggested a role for the pulvinar in alpha oscillations, its presence in the ranking indicates that it may contribute to the generation of the Berger effect, extending the neural origin of this phenomenon beyond traditional cortical generators to include subcortical structures.
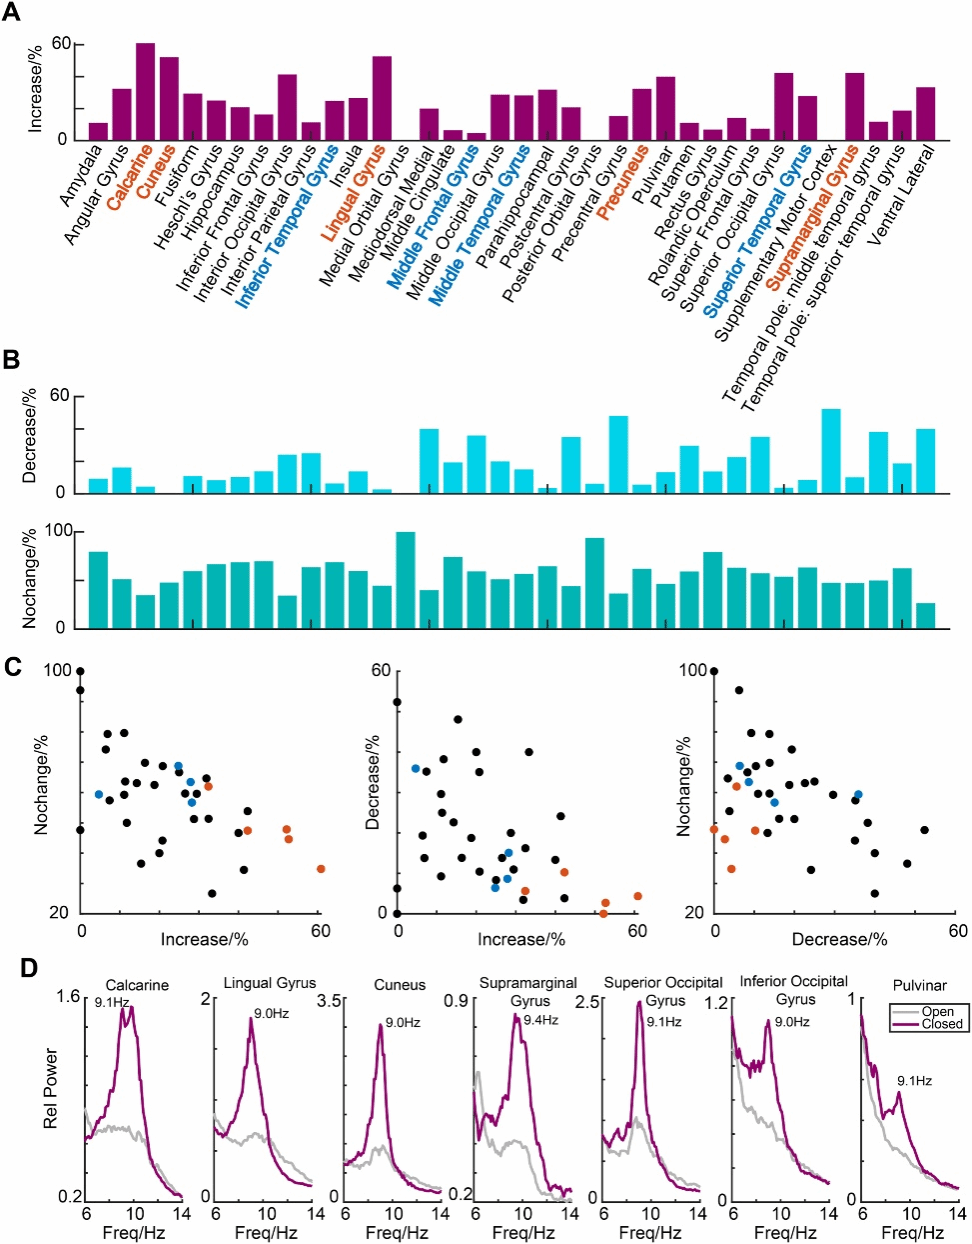
Figure 2. Berger effect at the individual (site) level.
The Berger Effect Is Primarily Driven by Periodic Activity
To further investigate the nature of alpha oscillations, the researchers decomposed the spectral data from all recording sites under both eyes-open and eyes-closed conditions into periodic (oscillatory) components and aperiodic (1/f background) components (Figure 3A). They first visualized the average periodic and aperiodic activity in the five posterior brain regions that showed strong Berger effects (Figure 3B).
Subsequently, the strength of the Berger effect for these two components was quantified by comparing alpha power between the eyes-closed and eyes-open states (Figure 3C). The results clearly demonstrated that the Berger effect primarily occurs in the periodic alpha-band activity.
In contrast, the aperiodic component within the alpha band showed either no significant difference between the two conditions (cuneus p = 0.14; precuneus p = 0.063; supramarginal gyrus p = 0.13) or even stronger power in the eyes-open condition (calcarine cortex p < 0.001; lingual gyrus p < 0.001).
This finding is particularly important, as it confirms that the dramatic increase in alpha power during the eyes-closed state fundamentally reflects a true oscillatory phenomenon. It also highlights the importance of separating genuine oscillatory components from the aperiodic background when investigating this classic neural effect.
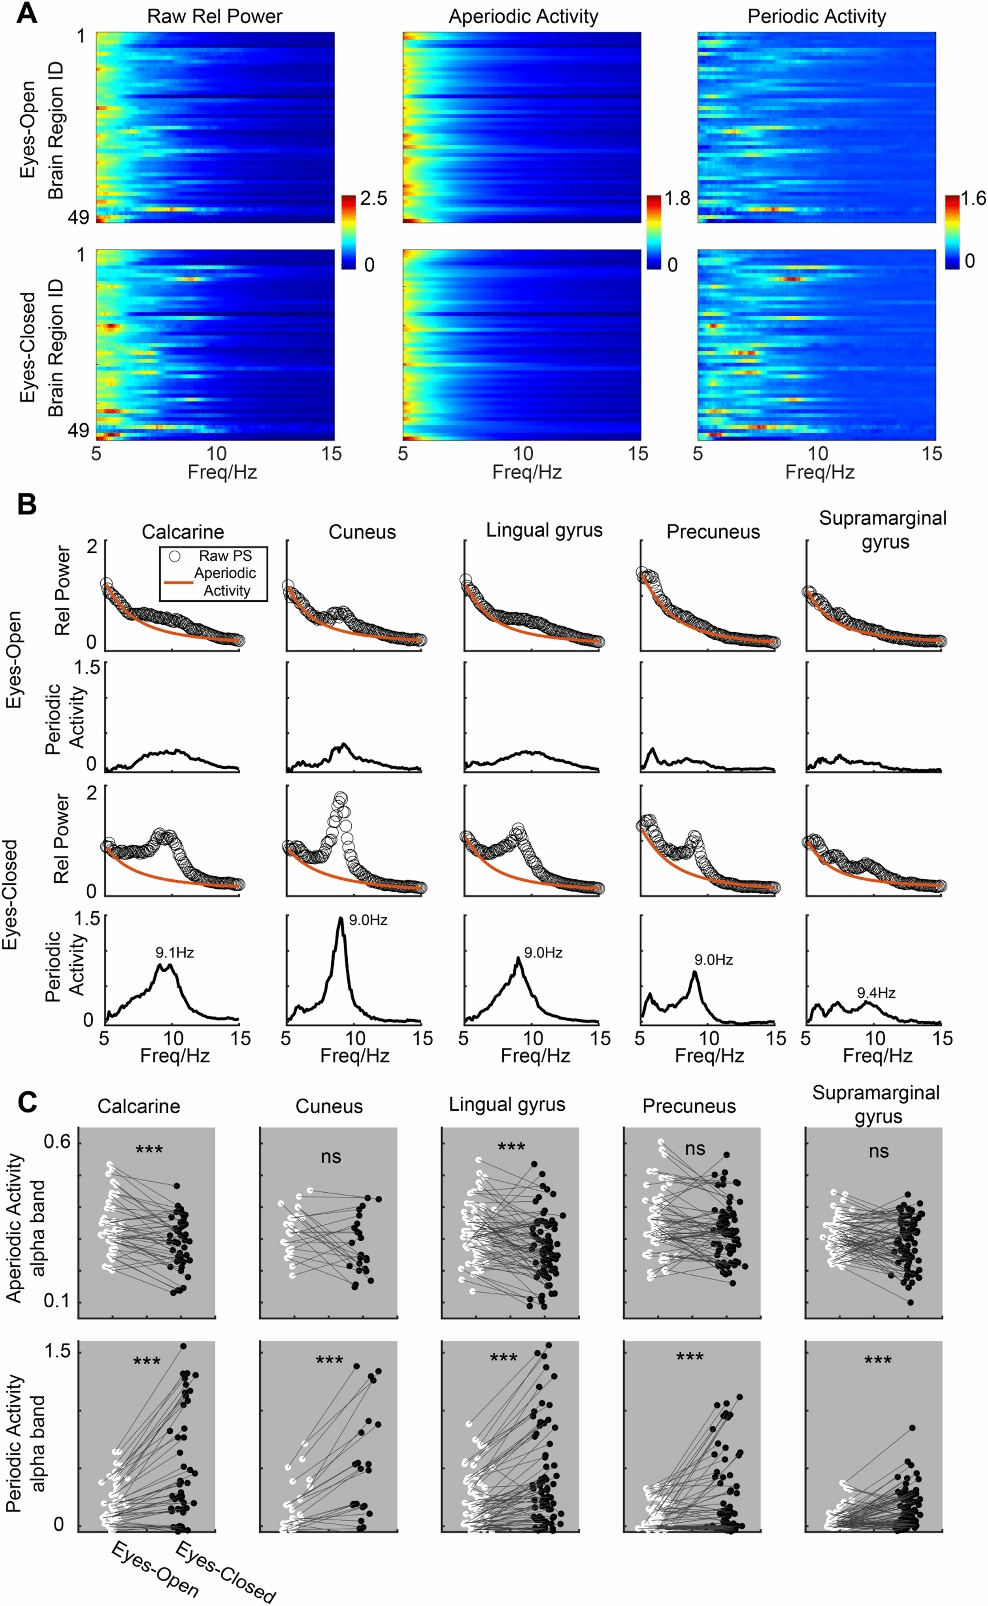
Figure 3. Decomposition of periodic and aperiodic components in the alpha band.
Intracranial Localization of the Classical Berger Effect Observed in Scalp EEG
Finally, the researchers sought to link the highly localized intracranial findings with the classical observations obtained from scalp electroencephalography (EEG) (Figure 4). In the present dataset, 19 of the 28 participants underwent simultaneous intracranial EEG (iEEG) and scalp EEG recordings using 10 scalp electrodes (Figure 4A). This provided a unique opportunity to directly relate the present iEEG findings to the extensive body of literature on the Berger effect based on scalp EEG recordings.
The scalp EEG analysis replicated well-established observations: alpha power over posterior electrodes was significantly stronger than that over central and frontal regions, and alpha power during the eyes-closed condition was significantly higher than during the eyes-open condition (p = 0.0019; Figure 4B). These results are fully consistent with previous resting-state EEG studies.
To more precisely localize the neural sources underlying the scalp signals, the researchers compared the similarity of alpha-band spectra between the eyes-open and eyes-closed conditions (Figure 4C shows the eyes-closed state, and Figure 4D shows the CO ratio). The results revealed that posterior intracranial regions exhibited the highest correlations with the alpha-band spectra recorded from scalp EEG, particularly the calcarine cortex and the supramarginal gyrus.
In addition, at the group level, the researchers compared the alpha peak frequency (APF) observed in scalp EEG during the eyes-closed condition with the APF measured in the five brain regions showing robust SEEG Berger effects (Figure 5). Overall, the APF measured with scalp EEG was highly consistent with that recorded by SEEG (Figures 5A–C). Notably, the calcarine cortex showed a significantly higher degree of alignment with scalp EEG than other regions (Figure 5D).
Together, these findings provide strong evidence that the classical Berger effect observed in scalp EEG primarily originates from neural activity within specific posterior cortical regions identified through intracranial recordings, particularly the calcarine cortex (Brodmann area 17).
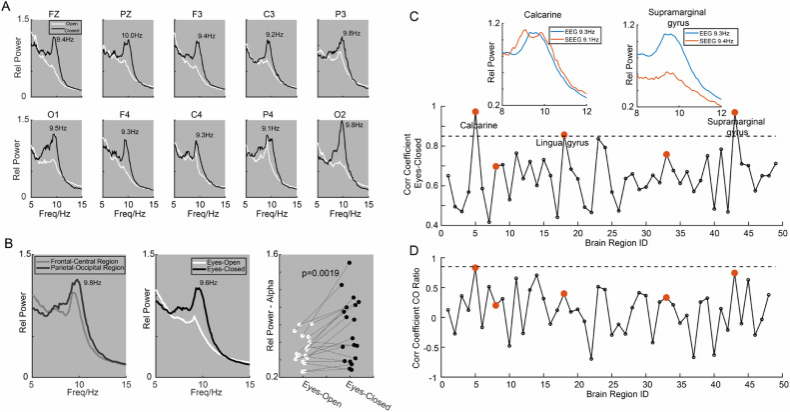
Figure 4. Comparison of alpha oscillations between SEEG and EEG.
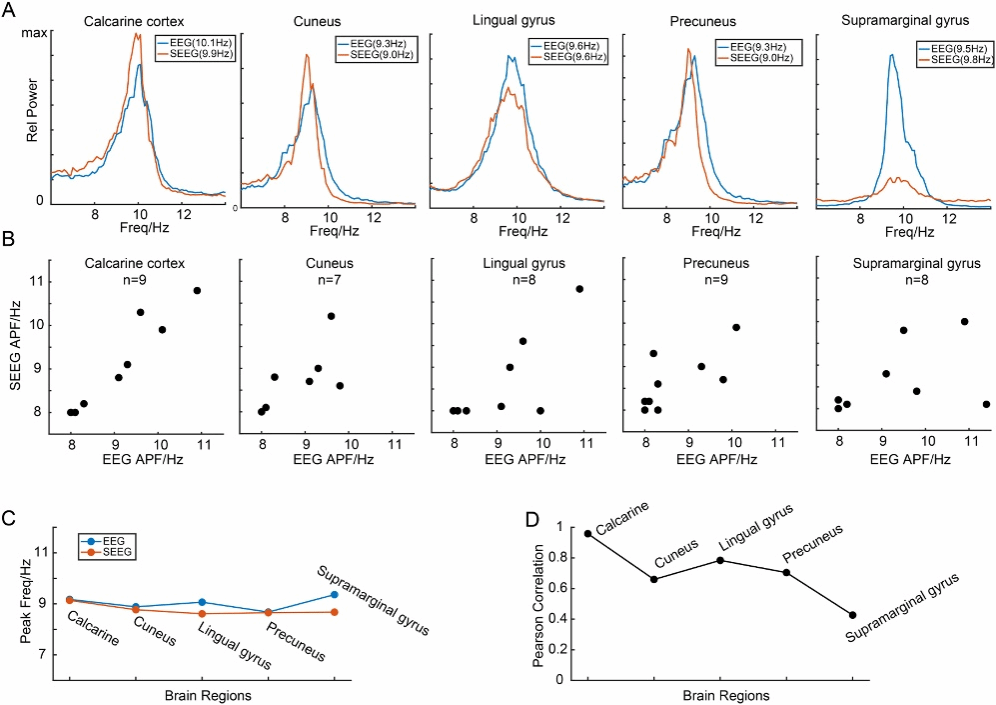
Figure 5. Comparison of alpha oscillation frequency consistency between SEEG and EEG.