The oscillatory dynamics of neural activity have long been a cornerstone of neuroscience, serving as a critical window into the brain's cognitive processes, sensory integration, and states of consciousness. Among these, alpha oscillations have remained a focal point since their discovery over a century ago, owing to their robust correlation with diverse physiological and psychological states. Traditionally, the prominent alpha rhythms observed in the occipital region during eye closure were characterized as a neural "idling" state or a mechanism for top-down inhibition of external interference. However, emerging evidence suggests that the alpha band is not a monolithic entity but a composite of distinct "sub-oscillations." For instance, low-frequency and high-frequency alpha components exhibit divergent spatial distributions and functional roles. Despite these observations, our understanding remains fragmented: the mechanisms governing the generation and regulation of these sub-oscillations, and their specific contributions across states of wakefulness versus anesthesia, stay largely elusive. Crucially, it remains unclear whether these sub-oscillatory signatures remain consistent across spatial scales, from intracranial local field potentials (LFP) to scalp-recorded electroencephalograms (EEG). Addressing these gaps is imperative for a holistic understanding of rhythmic brain activity.

On March 2, 2026, a collaborative study led by Assistant Professor Chuanliang Han from the School of Psychology at Shenzhen University, together with the Departments of Neurosurgery and Anesthesiology at Huashan Hospital, Fudan University (Prof. Jie Hu, Prof. Yingwei Wang, Dr. Shizhe Jiang, etc.), was published in Communications Biology (a prestigious Nature Portfolio journal). The paper is titled "Distinct origins of human low and high alpha rhythms revealed by simultaneous EEG-SEEG." Utilizing simultaneous stereoelectroencephalography (SEEG) and scalp EEG, the researchers captured local field potentials (LFPs) across 32 distinct human brain regions during the transition from wakefulness (eyes-closed) to anesthesia-induced loss of consciousness (LOC). The study revealed that prominent low alpha rhythm (LA, 8–10 Hz) in the occipital cortex during wakefulness gradually diminish as anesthesia deepens. These are subsequently replaced by widespread high alpha rhythm (HA, 10–13 Hz) across the brain—a phenomenon consistently observed at both the LFP and EEG levels. Furthermore, the team demonstrated that these state-dependent spectral shifts are primarily driven by periodic neural activities rather than aperiodic components, a transition effectively captured by a simple neurodynamic model. This work provides the first multiscale evidence of the distinct regulatory mechanisms underlying alpha sub-oscillations, offering profound insights into the neurobiology of anesthesia, consciousness, and potential clinical diagnostics.
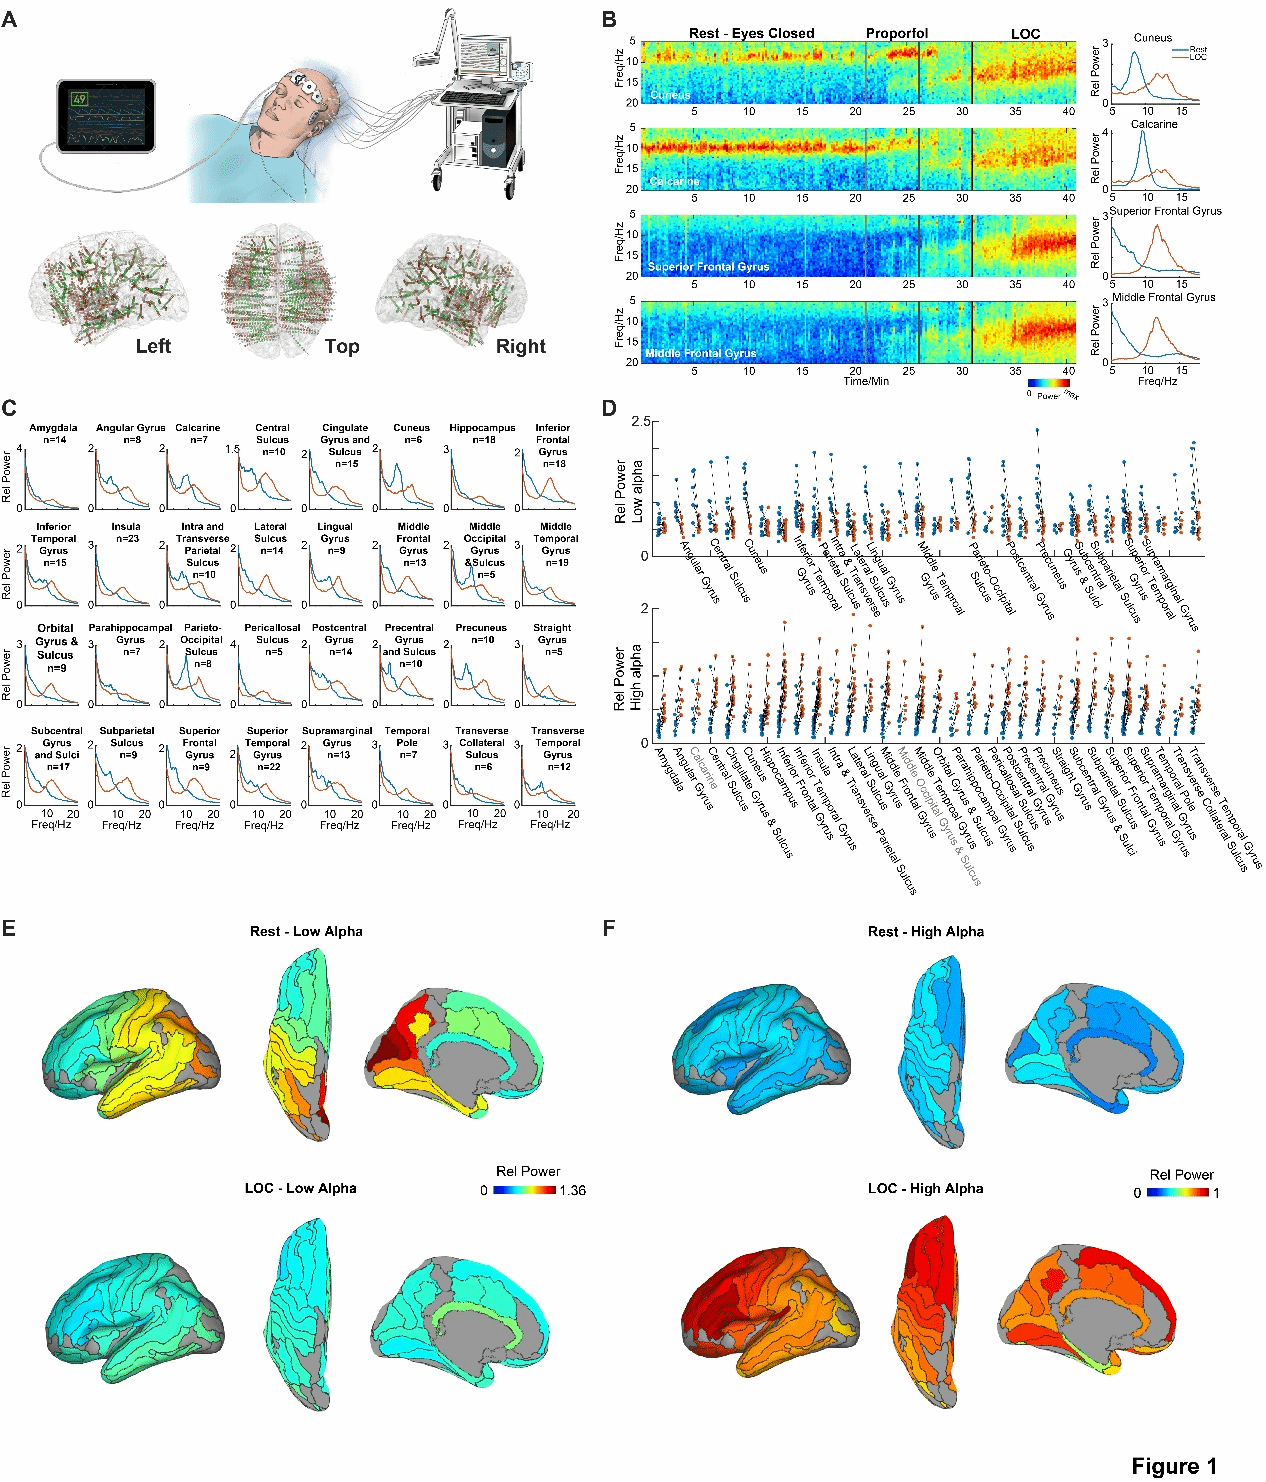
High alpha rhythm was induced during the loss of consciousness stage
In the state of eyes-closed wakefulness, the researchers observed a clear oscillation at around 10 Hz, especially in the occipital brain region. As shown in the first two rows of Figure 1A (the parietal lobe and the calcarine sulcus), it is notable that this alpha oscillation is not present in all brain regions. For example, such oscillations are not observed in the frontal brain regions (the superior frontal gyrus and the middle frontal gyrus, as shown in the last two rows of Figure 1A). When the dose of propofol was continuously increased until the subjects entered the loss of consciousness (LOC) state, the researchers were surprised to find that high alpha oscillations (approximately 12 Hz) emerged throughout the brain. Subsequently, we presented the results of 36 analysis brain regions throughout the brain (Figure 1B). By observing the group average spectrum, it was found that in the wakeful state, brain regions with low-frequency alpha peaks (approximately 9 Hz) were mainly concentrated in the posterior regions; while in the LOC state, most brain regions showed high-frequency alpha peaks (approximately 12 Hz). We further examined whether this phenomenon has good consistency at the individual level. By comparing the power differences of the low-frequency alpha band in the wakeful state and the LOC state (Figure 1C), it was found that the power of many posterior brain regions (including the angular gyrus, parietal lobe, posterior inferior temporal gyrus, parieto-inferior sulcus and parieto-occipital sulcus, lingual gyrus, middle temporal gyrus, parieto-occipital sulcus, posterior superior frontal gyrus, anterior parietal lobe, central inferior gyrus and sulcus, parieto-inferior sulcus, superior temporal gyrus, and superior parietal sulcus) decreased significantly (ps < 0.05). In contrast, in the whole brain, the power of the high-frequency alpha band in the LOC state was significantly higher than that in the wakeful state.
Distinct spatial scale of low and high alpha rhythms
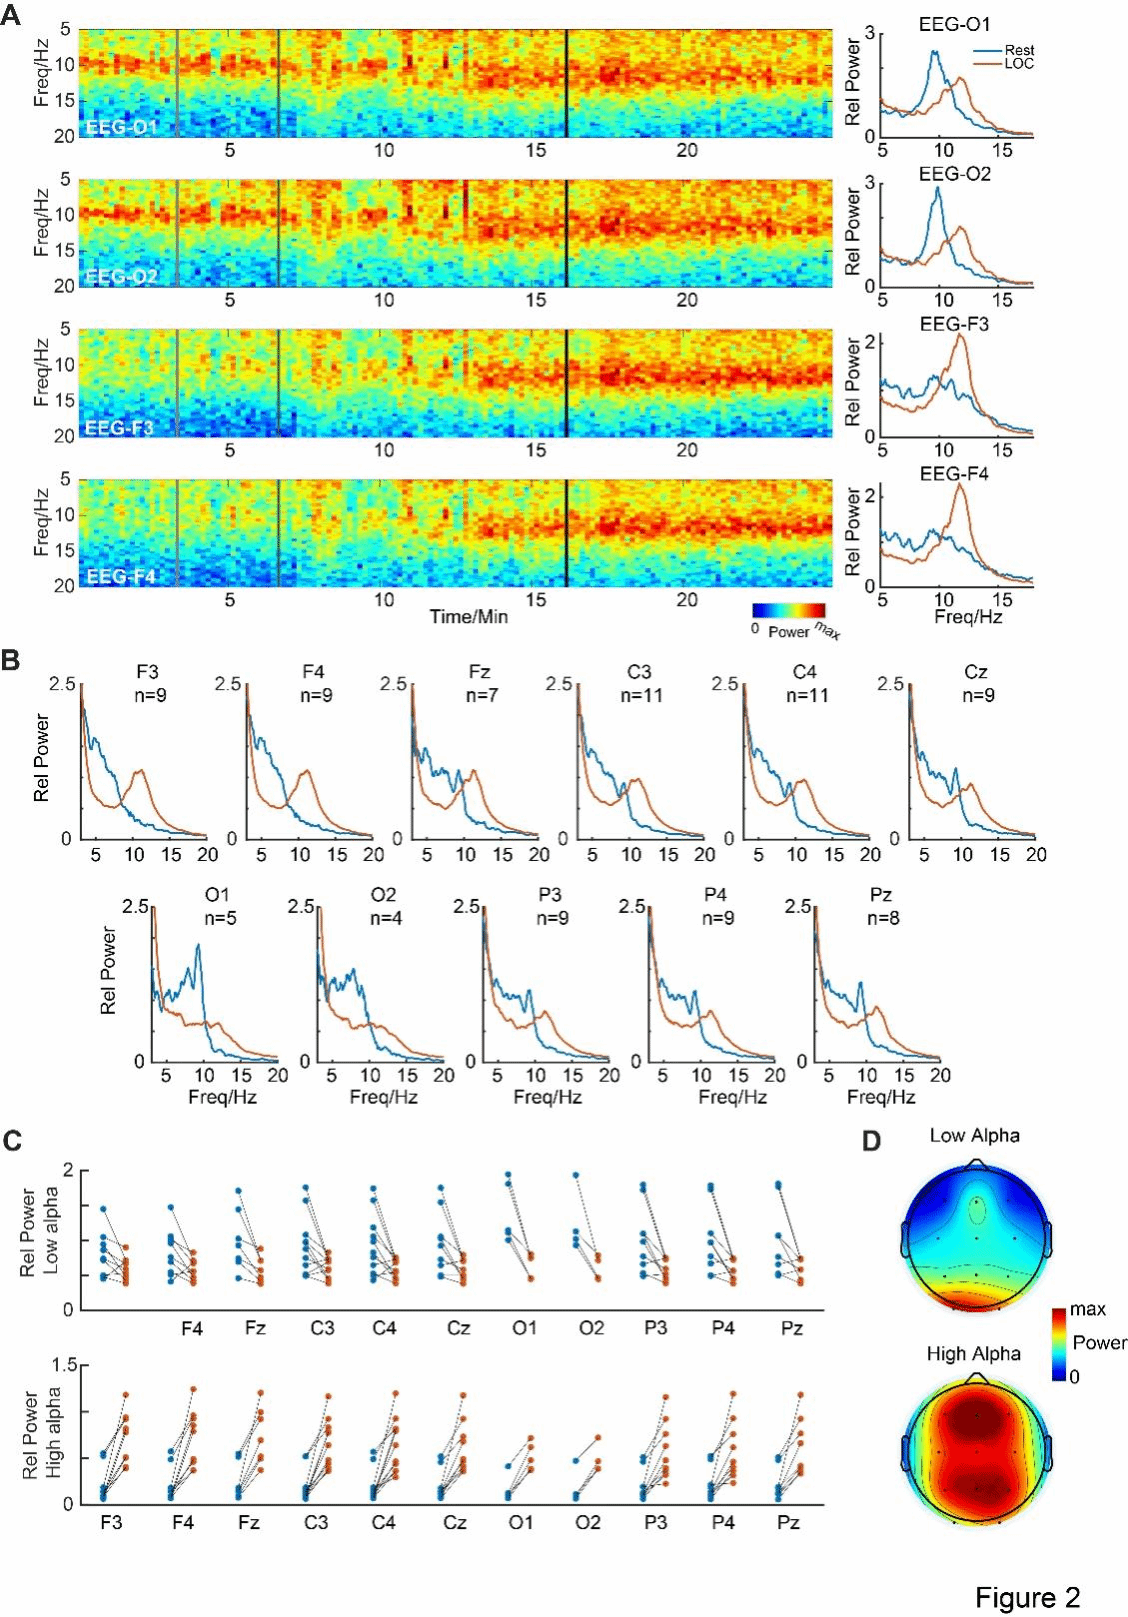
In addition to the SEEG data collected from 24 patients, the researchers also obtained the scalp electroencephalogram (EEG) data of 11 of the patients. The results showed that the scalp EEG was highly consistent with the intracranial local field potential (LFP) findings. In the occipital sample electrodes O1 and O2, strong low-frequency alpha oscillations were observed in the awake state, while high-frequency alpha oscillations were induced when the subjects entered the LOC state. However, in the frontal sample electrodes (F1 and F2), no strong low-frequency alpha was observed in the awake state, but high-frequency alpha oscillations were induced in the LOC state. Subsequently, the researchers presented the results of all 11 analyzed electrodes (Figure 2B). The group average spectrum observation showed that the low-frequency alpha peaks were mainly concentrated in the occipital lobe in the awake state; while in the LOC state, most EEG electrodes showed high-frequency alpha peaks. The individual-level analysis (Figure 2C) also confirmed this consistency: in the low-frequency alpha band, the power of electrodes O1 and O2 significantly decreased in the LOC state (ps < 0.05); while in the high-frequency alpha band, the power of all electrodes in the LOC state was significantly increased compared to the awake state (ps < 0.05).
Both intracranial neural activity and scalp EEG showed the same phenomenon: low-frequency and high-frequency alpha oscillations are regulated by brain states. When the inhibitory effect increases, the alpha frequency changes from low to high (Figure 1B, 2B), and the spatial scale also changes (Figure 2D). Figure 3A shows the high consistency of the group average spectra of intracranial and scalp EEG in the awake and LOC states. In addition, the correlation analysis of the SEEG and EEG spectra in both states (Figure 3B) showed that in many brain regions, the EEG electrodes had a very high correlation with the SEEG spectra (> 0.9). It is notable that the correlation positions between the occipital EEG electrodes in the awake state and the intracranial brain regions, and the correlation positions between the frontal EEG electrodes in the LOC state and the intracranial brain regions, present a clear inverted phenomenon. This once again indicates that the loop mechanisms of the two alpha oscillations in the brain are completely different.

Periodic instead of aperiodic activity contributes to the property of alpha rhythms
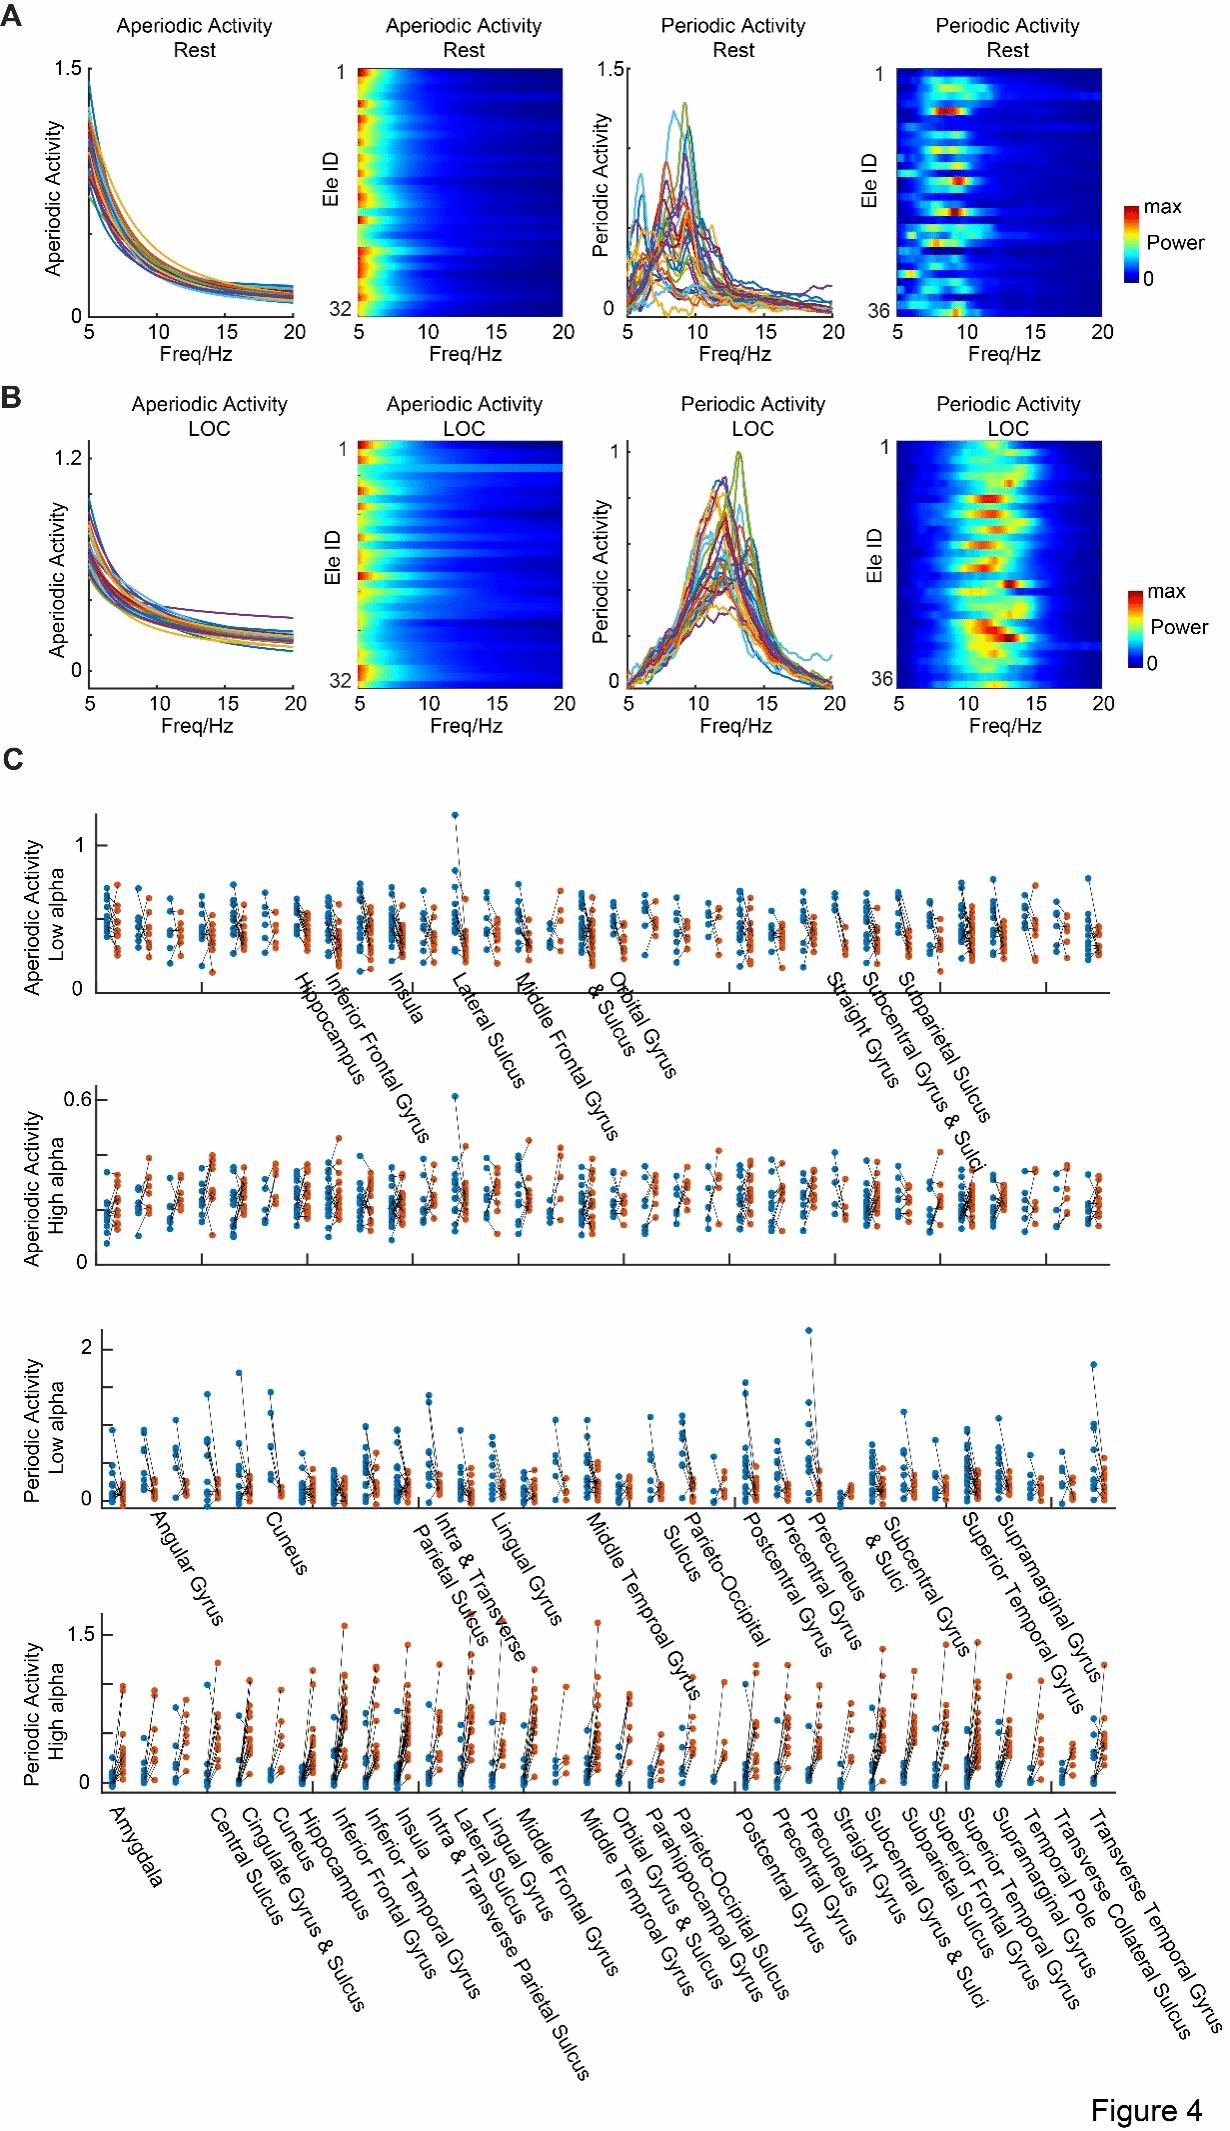
Furthermore, the researchers utilized descriptive models to separate the periodic and non-periodic components in the wakeful state (Figure 4A) and the LOC state (Figure 4B). In the non-periodic activities, the low-frequency alpha band activity in the posterior brain regions during the LOC state did not show a significant decrease as previously described, but occurred in other brain regions (Figure 3C, first row); and there was no difference in the high-frequency alpha band activity between the two states (Figure 3C, second row). In the periodic activities (Figure 3C, last two rows), the same results as in Figure 1 were obtained. This indicates that this state-dependent alpha oscillation mainly originates from periodic activities rather than non-periodic activities.
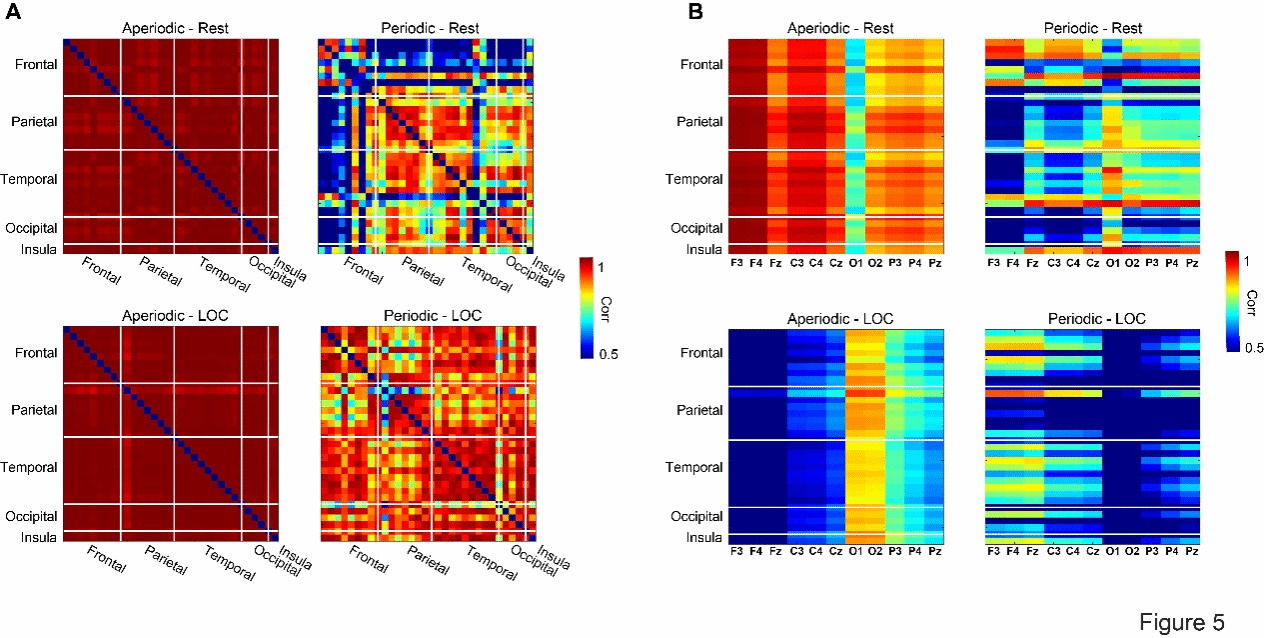
In addition, the researchers deeply explored the similarities between the intracranial brain regions (Figure 5A) and the intracranial and scalp electroencephalogram (EEG) power spectra (Figure 5B) in the non-periodic and periodic components. It was found that the non-periodic components showed extremely high similarity in all intracranial brain regions, regardless of whether it was in the resting state or the LOC state. This finding is highly consistent with the inherent 1/f characteristic of neural activity. In contrast, the periodic components, representing oscillatory activities, exhibited significant spatial specificity. In the resting state, there was a high similarity within and between the temporal lobe, parietal lobe, and occipital lobe, while the similarity with the frontal lobe was lower. However, in the LOC state, the similarity across the entire brain area significantly increased, especially within the frontal lobe, parietal lobe, and temporal lobe, as well as between the frontal and temporal regions. Regarding the contribution of intracranial components to scalp EEG (Figure 5B): In the resting state, the non-periodic activities in the intracranial region mainly contributed to the scalp EEG in the frontal-parietal area; the periodic activities of the frontal lobe had the highest similarity with the frontal scalp electrodes, while the periodic activities of the intracranial parietal, temporal, and occipital regions were most compatible with the occipital scalp EEG. After entering the LOC state, the main contribution area of the intracranial non-periodic activities shifted to the parieto-occipital scalp region, while the periodic activities of the frontal and temporal regions became the main driving force for the frequency spectrum of the frontal-parietal scalp EEG.
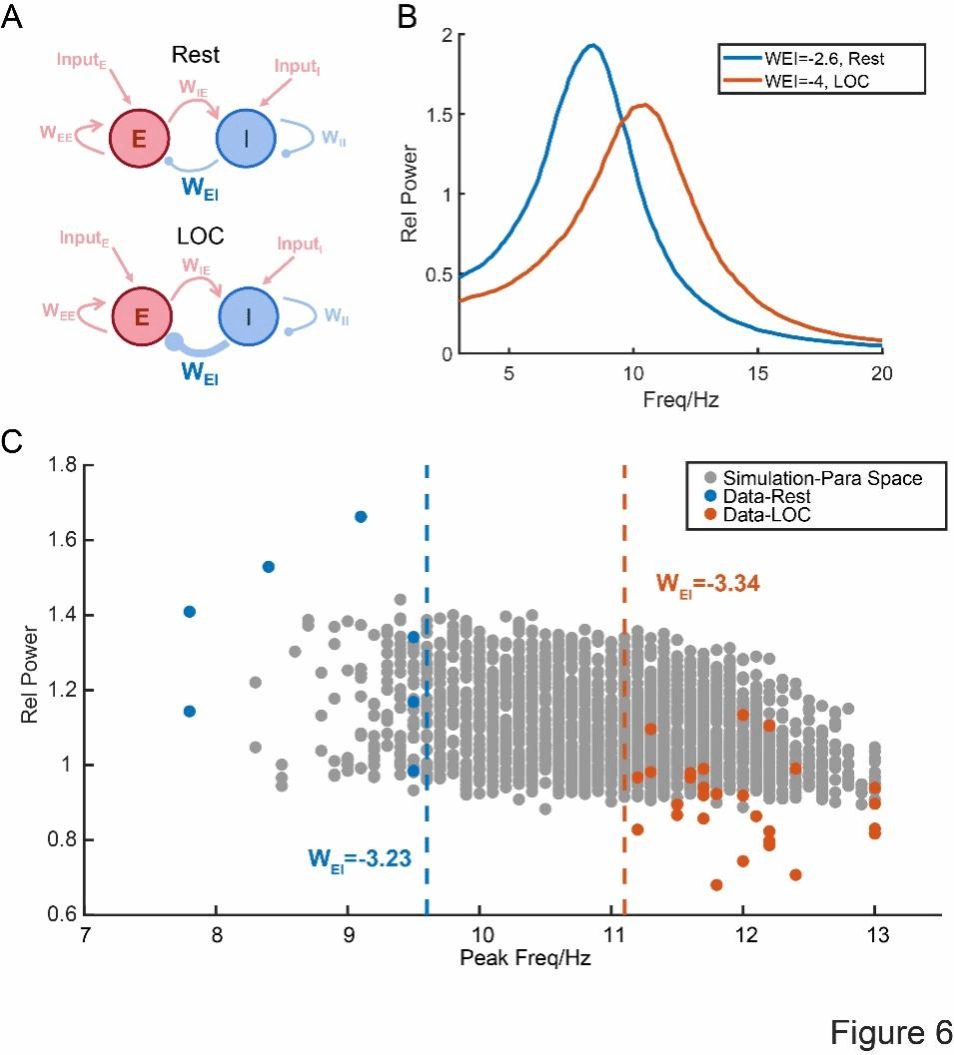
Finally, to propose a possible mechanism explanation, the researchers established a simple dynamical model describing the interaction between excitatory and inhibitory neurons, respectively simulating low-level and high-level inhibitory connections (Figure 6A), and performed spectral analysis on the generated time series. Surprisingly, the results showed that after enhancing the inhibitory effect, the frequency of the alpha rhythm significantly increased (Figure 6B), which was in perfect agreement with the actual experimental data. Subsequently, we expanded the simulation based on a wide range of parameter combinations of excitatory-excitatory connections (WEE) and inhibitory-excitatory connections (WEI). For each connection condition, the average power spectrum was calculated to extract the peak frequency and power within the alpha band. Specific brain regions with significant alpha peaks were identified in the measured data: 7 brain regions in the resting state and 29 brain regions in the LOC state, with the peak frequency and power represented by the blue and orange points in Figure 6C. Notably, the simulation results (gray points in Figure 6C) effectively filled the gap between the measured resting state and LOC state. In the simulation parameter space, the average WEI value near the resting state region was -3.23, while the value near the LOC state region was -3.34. These findings indicate that this simulation model successfully captures a core mechanism transformation: the enhanced inhibitory effect drives the frequency conversion of alpha oscillation from low frequency to high frequency.